Saving Electricity by Planning AC in a Server Room
Published 16 September 2022
Servers in a server room need to be kept within a suitable temperature range to avoid reduced reliability and accelerated ageing of components. With increasing electricity prices, it also becomes important to minimise the energy used for cooling.
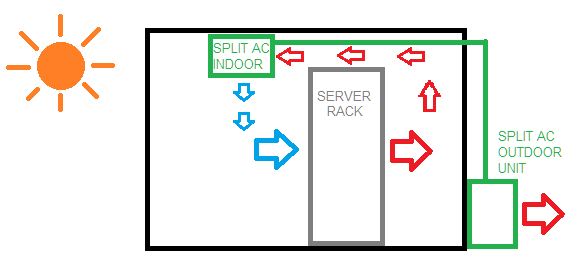
Standard server-room cooling
A typical small server room has a split air-conditioning unit. The servers heat the air inside the room and the AC unit removes that heat, maintaining a temperature of, for example, 20 °C.
If the heat load is significant, the air conditioner may need to run its compressor almost continuously.
Low-cost cooling
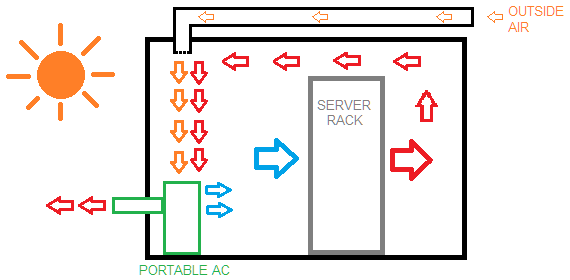
A split AC is sometimes replaced by a portable floor-standing air conditioner. It blows cool air into the room and exhausts hot air through a hose, typically through a window or wall.
Such a unit has a lower installation cost and can easily be replaced if it fails. However, because it exhausts air from the room, replacement air must enter from outside. This makes the arrangement less efficient when the outdoor temperature is high.
For a small or medium-sized unit, the difference in electrical consumption can be substantial: approximately 900 W with the compressor running compared with perhaps 50 W when only the internal fan is operating.
- Low installation cost
- Easy and quick to replace
- Less efficient when the outside temperature is high
Making use of outside air
In Sweden the outside air is often cold. Even in southern Sweden, temperatures are frequently below 10 °C during winter. Instead of running a refrigeration compressor, we can therefore use outside air directly to cool the servers.
In this example, outside air is drawn through an inlet in the ceiling in front of the server rack. If a portable AC is also used, this inlet supplies its replacement air during summer. The inlet should therefore preferably not be placed where it is heated by direct sunlight.
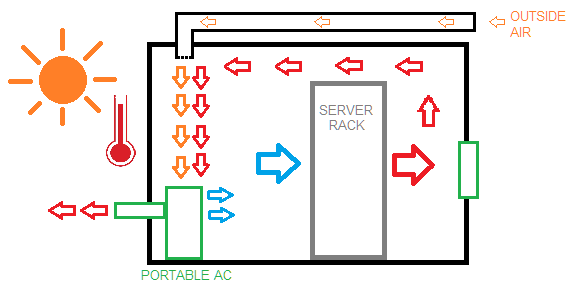
An air inlet alone is not sufficient during winter. The AC fan may be too small, or may not run at all when the compressor is stopped. An additional exhaust fan can therefore be installed behind the rack to remove the heated air from the room.
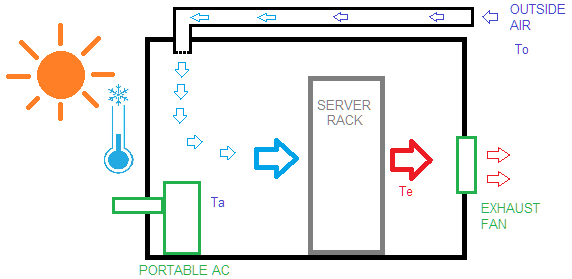
Controlling the exhaust fan
If the AC setpoint is 20 °C, the compressor will eventually stop when the outdoor temperature becomes low enough. If the outside temperature rises again, however, the exhaust fan should not continue pulling warm outside air into the room.
A simple first condition could be:
FAN_ON = if (To < 16)
where To is the outside temperature.
A better approach is to compare the room temperature
Ta with the outside temperature:
FAN_ON = if (Ta > To)This requires at least two temperature sensors. Once sensors are available, the temperatures can also be logged and alarms generated if something goes wrong.
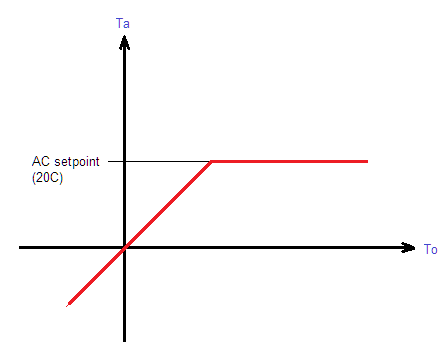
We probably do not want the server-room temperature to follow the outside temperature all the way below freezing. A lower room-temperature limit can therefore be added. I used 12 °C:
FAN_ON = if (Ta > To) && (Ta > 12)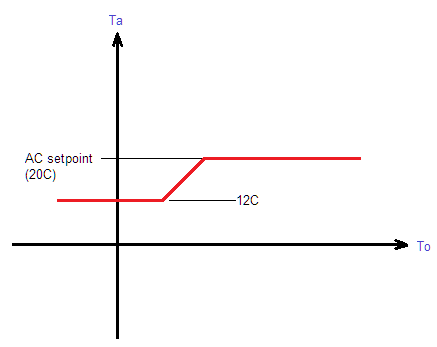
The ordinary AC remains as the upper temperature control and backup cooling system. The exhaust fan provides low-power cooling whenever the outside conditions allow it.
The TSTR04
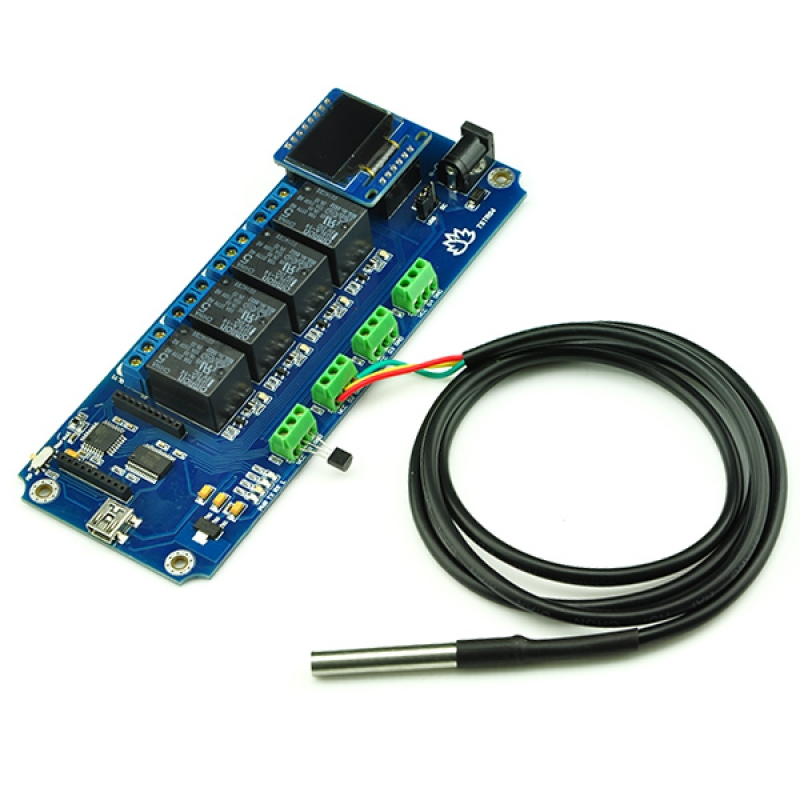
While looking for a simple controller I found the TSTR04 relay board from TinySine. Since there are already powerful servers running nearby, it seemed unnecessary to add another complete Raspberry Pi or similar computer merely to control a fan.
The TSTR04 connects directly to a server through USB and has four onboard relays. It also supports four external waterproof temperature sensors. The relays can operate using an automatic thermostat function or can be controlled manually over USB.
The USB interface appears as a normal virtual COM port operating at 9600 baud, 8N1.
Serial commands
A  Set Auto mode
B  Set Manual mode
C  Get working mode
D  Get state: 9 bytes, relay + temperature

O  Set ch 1 threshold: MSB+LSB(ON)+MSB+LSB(OFF)
P  Set ch 2 threshold: MSB+LSB(ON)+MSB+LSB(OFF)
Q  Set ch 3 threshold: MSB+LSB(ON)+MSB+LSB(OFF)
R  Set ch 4 threshold: MSB+LSB(ON)+MSB+LSB(OFF)
S  Set ch 5 threshold: MSB+LSB(ON)+MSB+LSB(OFF)
T  Set ch 6 threshold: MSB+LSB(ON)+MSB+LSB(OFF)
U  Set ch 7 threshold: MSB+LSB(ON)+MSB+LSB(OFF)
V  Set ch 8 threshold: MSB+LSB(ON)+MSB+LSB(OFF)

Z  Get version, 2 bytes: module ID + software version
[  Get relay states (1 byte)
\  Set relay states, 255 = all on

d  All relays to position 1
e  Relay 1 to position 1
f  Relay 2 to position 1
g  Relay 3 to position 1
h  Relay 4 to position 1
i  Relay 5 to position 1
j  Relay 6 to position 1
k  Relay 7 to position 1
l  Relay 8 to position 1

n  All relays to position 0
o  Relay 1 to position 0
p  Relay 2 to position 0
q  Relay 3 to position 0
r  Relay 4 to position 0
s  Relay 5 to position 0
t  Relay 6 to position 0
u  Relay 7 to position 0
v  Relay 8 to position 0
Some TSTR04 observations
- The unit restarts when the serial port is opened under Windows. Startup takes approximately five seconds, during which it does not respond to commands. This makes a script periodically started from cron inconvenient.
-
The built-in thermostat Auto mode is intended for heating,
i.e.
TOFF > TON. Since the relays are SPDT, it can nevertheless be wired for cooling. -
In Auto mode the relay does not activate if the unit starts
inside the hysteresis band. For example, with
TON=15°CandTOFF=30°C, starting at 20 °C does not activate the relay. This appears to be intentional behaviour. - The small display is OLED, which may suffer from ageing or burn-in during continuous operation.
- The waterproof DS18B20 sensor wiring supplied with my unit was: red = VCC, yellow = DATA, green = GND.
I did not use Auto mode because my fan-control condition depends on two temperature measurements. For a simpler installation the internal thermostat could still be useful.
Creating an RRD database
The goal is to connect the sensor/relay board to a Linux server, let the server control the cooling fan and store temperature history for graphs.
RRDTool and its Python support were installed with:
apt-get install rrdtool python-rrdtool librrd-dev
pip3 install rrdtool
The database was created using:
#!/bin/bash

XDBXFILE=/var/log/temp_rack.rrd

if [ ! -f "$XDBXFILE" ]; then

    /usr/bin/rrdtool create "$XDBXFILE" \
        --step 150s \
        DS:temp1:GAUGE:180:-30:50 \
        DS:temp2:GAUGE:180:-30:50 \
        DS:temp3:GAUGE:180:-30:50 \
        DS:temp4:GAUGE:180:-30:50 \
        RRA:LAST:0.5:150s:7d \
        RRA:AVERAGE:0.5:1d:10y \
        RRA:MIN:0.5:1d:10y \
        RRA:MAX:0.5:1d:10y
fi
The resulting database is small — approximately 472 kB — while retaining years of temperature history.
Reading temperatures and controlling the fan
Since the fan-control decision requires measurements from two sensors, I controlled the TSTR04 manually from a Python program.
The program reads the sensors once per second, evaluates the relay state once per minute to avoid unnecessary relay and fan cycling, and updates the RRD database every 150 seconds.
# -*- coding: utf-8 -*-

import rrdtool
import time
from time import sleep
import serial

TSTRSerialPortName="/dev/ttyUSB2"

def print_hex_list(data):
    print('[{}]'.format(', '.join("0x%02x"%x for x in data)), end='')

def sbin(num):
    global b
    if(num > 1):
        sbin(num // 2)
    b=b+str(num % 2)

def Print_bin(n):
    global b
    b=""
    sbin(n)
    b="00000000"+b
    b=b[-8:]
    print(b)

def TSTR_ask(s):
    serportTSTR.reset_input_buffer()
    serportTSTR.write(bytes(s,'utf-8'))
    r=serportTSTR.read_until()
    return r

def TSTR_askfor(s,n):
    serportTSTR.reset_input_buffer()
    serportTSTR.write(bytes(s,'utf-8'))
    r=serportTSTR.read(n)
    return r

def Temp_Get():
    t={}
    v=TSTR_askfor('D',9)

    t[0]=0.0625*int.from_bytes(v[1:3], "little", signed=True)
    t[1]=0.0625*int.from_bytes(v[3:5], "little", signed=True)
    t[2]=0.0625*int.from_bytes(v[5:7], "little", signed=True)
    t[3]=0.0625*int.from_bytes(v[7:9], "little", signed=True)

    return t,v[0]

# Temp_SetMode(0): Auto
# Temp_SetMode(1): Manual
def Temp_SetMode(m):
    serportTSTR.write((b'A'[0]+m).to_bytes(1,'big'))

def Temp_GetMode():
    return int.from_bytes(TSTR_askfor('C',1),'big')-65

def Relay_Set(r,s):
    if s:
        serportTSTR.write((b'e'[0]+r).to_bytes(1,'big'))
    else:
        serportTSTR.write((b'o'[0]+r).to_bytes(1,'big'))

def Relay_AllOn():
    serportTSTR.write(b'd')

def Relay_AllOff():
    serportTSTR.write(b'n')

if __name__ == "__main__":

    serportTSTR=serial.Serial(
        port=TSTRSerialPortName,
        baudrate=9600,
        bytesize=8,
        timeout=1,
        stopbits=serial.STOPBITS_ONE)

    v=TSTR_ask('C')
    print("Starting...")
    time.sleep(4)

    serportTSTR.timeout=1

    print("Version:",end='')
    v=TSTR_askfor('Z',2)
    print_hex_list(v)
    print("")

    Temp_SetMode(1)
    Relay_AllOff()

    ticks=0
    ticks_relay=0

    while 1:

        t,r=Temp_Get()

        for i in range(0,4):
            print(str(ticks).zfill(4)+": T"+str(i)+": "+str(t[i]))

        print(str(ticks).zfill(4)+": Relay:",end="")
        Print_bin(r)

        if ticks_relay >= 60:
            ticks_relay=0

            # T0 = outside temperature
            # T1 = rack rear / exhaust temperature
            # T2 = rack front / inlet temperature

            if (t[2] > 12) and (t[0] < t[2]):
                Relay_Set(0,1)
            else:
                Relay_Set(0,0)

        if ticks >= 150:
            ticks=0
            rrdtool.update(
                '/var/log/temp_rack.rrd',
                'N:'+str(t[0])+":"+str(t[1])+":"+str(t[2])+":"+str(t[3])
            )

        time.sleep(1)
        ticks += 1
        ticks_relay += 1

serportTSTR.close()/dev/ttyUSB2, for example by
membership in the dialout group. The user also
needs write access to the RRD database.
The sensor assignments in my installation were:
T0 = To— outside temperatureT1 = Te— rear of rack / exhaust airT2 = Ta— front of rack / inlet airT3— additional room/side measurement
Typical output:
Starting...
Version:[0x0f, 0x02]

0000: T0: 12.125
0000: T1: 23.125
0000: T2: 16.1875
0000: T3: 20.5625
0000: Relay:0000

0001: T0: 12.1875
0001: T1: 23.1875
0001: T2: 16.3125
0001: T3: 20.5
0001: Relay:0001
Generating graphs
RRDTool can generate daily, weekly and yearly PNG graphs. In my installation the graph-generation script created:
rack_daily-temperature.png
rack_weekly-temperatures.png
rack_yearly-temperature_outside.png
rack_yearly-temperature_rear.png
rack_yearly-temperature_front.png
rack_yearly-temperature_side.png
The original script used rrdtool graph with
separate AVERAGE, MIN and
MAX data sources for the different time ranges.
A resulting daily graph looked like this:
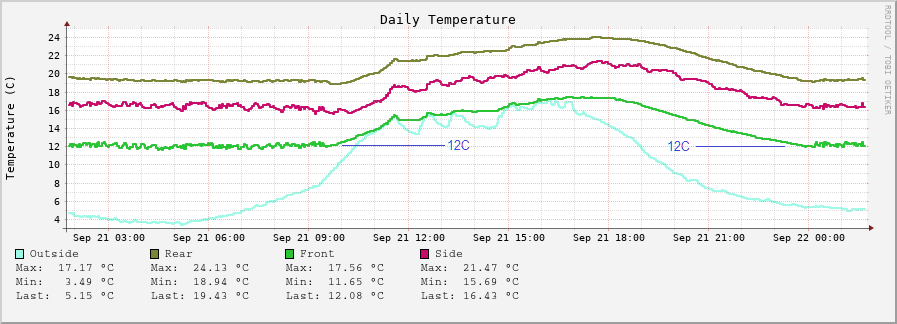
The blue marker at 12 °C shows the lower temperature limit. The exhaust fan regulates the front temperature so that it does not fall below this point. At the other end, the AC unit would start if the front temperature rose above its setpoint, for example 20 °C.
Displaying the graphs on a web page
I generated the graphs on demand from a PHP page. The essential part looked like this:
<?php

$cmd="sudo /var/www/lan/sh/temps/rack_generate_graphs.sh";

header('X-Accel-Buffering: no');

while (@ob_end_flush());

$proc = popen($cmd, 'r');

while (!feof($proc)) {
    echo fread($proc, 4096);
    @flush();
}

echo '
<img src="/temps/rack_daily-temperature.png?dummy=' . rand() . '">
<img src="/temps/rack_weekly-temperatures.png?dummy=' . rand() . '">
';

?>
The randomized ?dummy=... query parameter was used
to prevent browsers, particularly Chrome on Android in my
testing, from displaying an old cached graph.
Since the PHP process used sudo to execute the
graph-generation script, the installation had a narrowly
specified sudoers entry:
www-data ALL = NOPASSWD:/var/www/lan/sh/temps/rack_generate_graphs.shsudo has security implications. If this approach
is used, restrict the sudoers rule to the exact command and
ensure that neither the script nor anything it executes is
writable by the web-server user.
Result
The result is a relatively simple hybrid cooling system. During warm weather the air conditioner provides conventional cooling. When the outside air is sufficiently cold, a much lower-power exhaust fan takes over.
The same temperature sensors used for control also provide long-term monitoring, making it possible to verify the cooling behaviour and detect abnormal temperatures.